
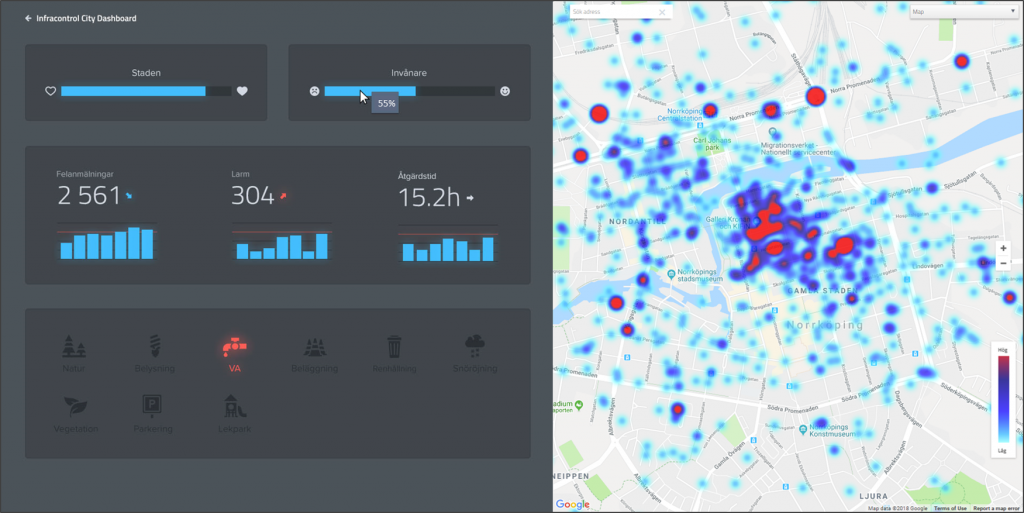
Infracontrol City Dashboard provides a quick, intuitive overview of the municipal situation. The image shows a view from a contact center. There are other views for different types of case handler, operations personnel or municipal executives.
Infracontrol City Dashboard
We recently launched our entirely new City Dashboard, which provides a quick overview of the municipal situation. Information about fault reports, alarms and readings are collected, processed and visualized in a simple and intuitive way.
Sometimes people don’t need a whole lot of details, just a quick overview of the situation right now; that everything looks good, or there’s some area that needs extra attention. So we created this dashboard to form part of Infracontrol Online. Simple, graphic elements provide information and a feel for the current situation.
- Heat map that shows fault reports and alarms in terms of the numbers, priority and locations.
- Gauge that shows the city’s health as a weighted value from active fault reports and alarms.
- Resident satisfaction based on information from fault reports received is showed in a simple gauge.
- Small, simple bar charts show the current situation and trends based on the number of faults and alarms and average rectification time.
- Control lamps light up when there are unusual many problems in a given area, based on information from fault reports and alarms.


